

02 May 2025
When we need an overall view of an OpenStack load balancer — or we’re troubleshooting one in an ERROR or DEGRADED state — the usual approach is time-consuming and tedious. Typically, it involves running a series of OpenStack CLI commands to piece together the status and relationships of each component:
$ openstack loadbalancer show <lb_id>
$ openstack loadbalancer listener list --loadbalancer <lb_id>
$ openstack loadbalancer listener show <listener_id>
$ openstack loadbalancer pool list --loadbalancer <lb_id>
$ openstack loadbalancer member list <pool_id>
$ openstack loadbalancer healthmonitor show <healthmonitor_id>
...
Because I’m often asked to help diagnose load balancer issues,
I built openstack-lb-info, a CLI tool that automates these checks and delivers a clear, consolidated
view with a single command.
openstack-lb-info is a CLI utility that connects to an OpenStack cloud and retrieves information about
load balancers and their components such as listeners, pools, health monitors, members, and amphorae.
The script aggregates and presents the data in a clear, human-readable format, giving you a quick, comprehensive overview of the load balancer.
It supports multiple output formats:
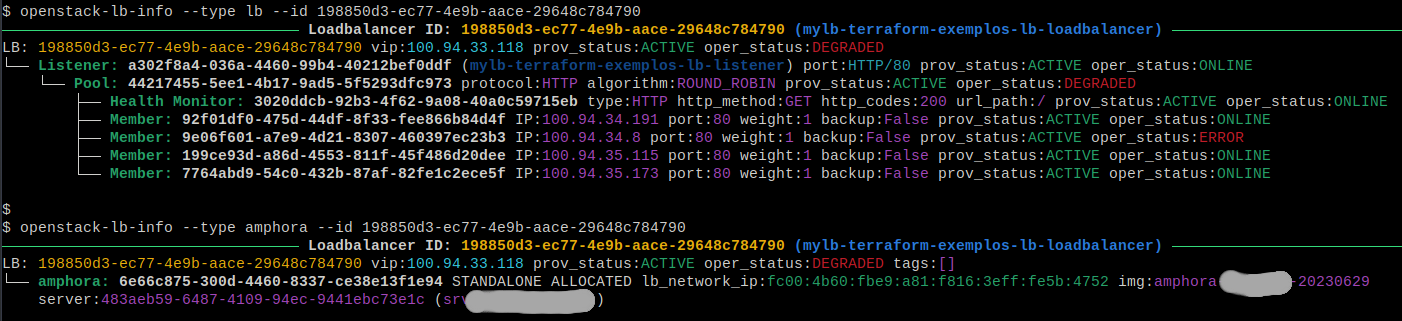
Example:
Find the code and instructions in the GitHub repository.
While openstack-lb-info provides a useful snapshot of a load balancer’s configuration and status,
for continuous visibility we should use
Octavia’s native Prometheus metrics export.
Starting with the OpenStack Yoga release, Octavia introduced support for Prometheus listeners. This feature lets us create a Prometheus listener to expose metrics about load balancers, listeners, pools, and members. These metrics can then be scraped by Prometheus and integrated into systems like Grafana for automated alerting and dashboards.